
Stablecoin flows 2026: The scale versus share gap
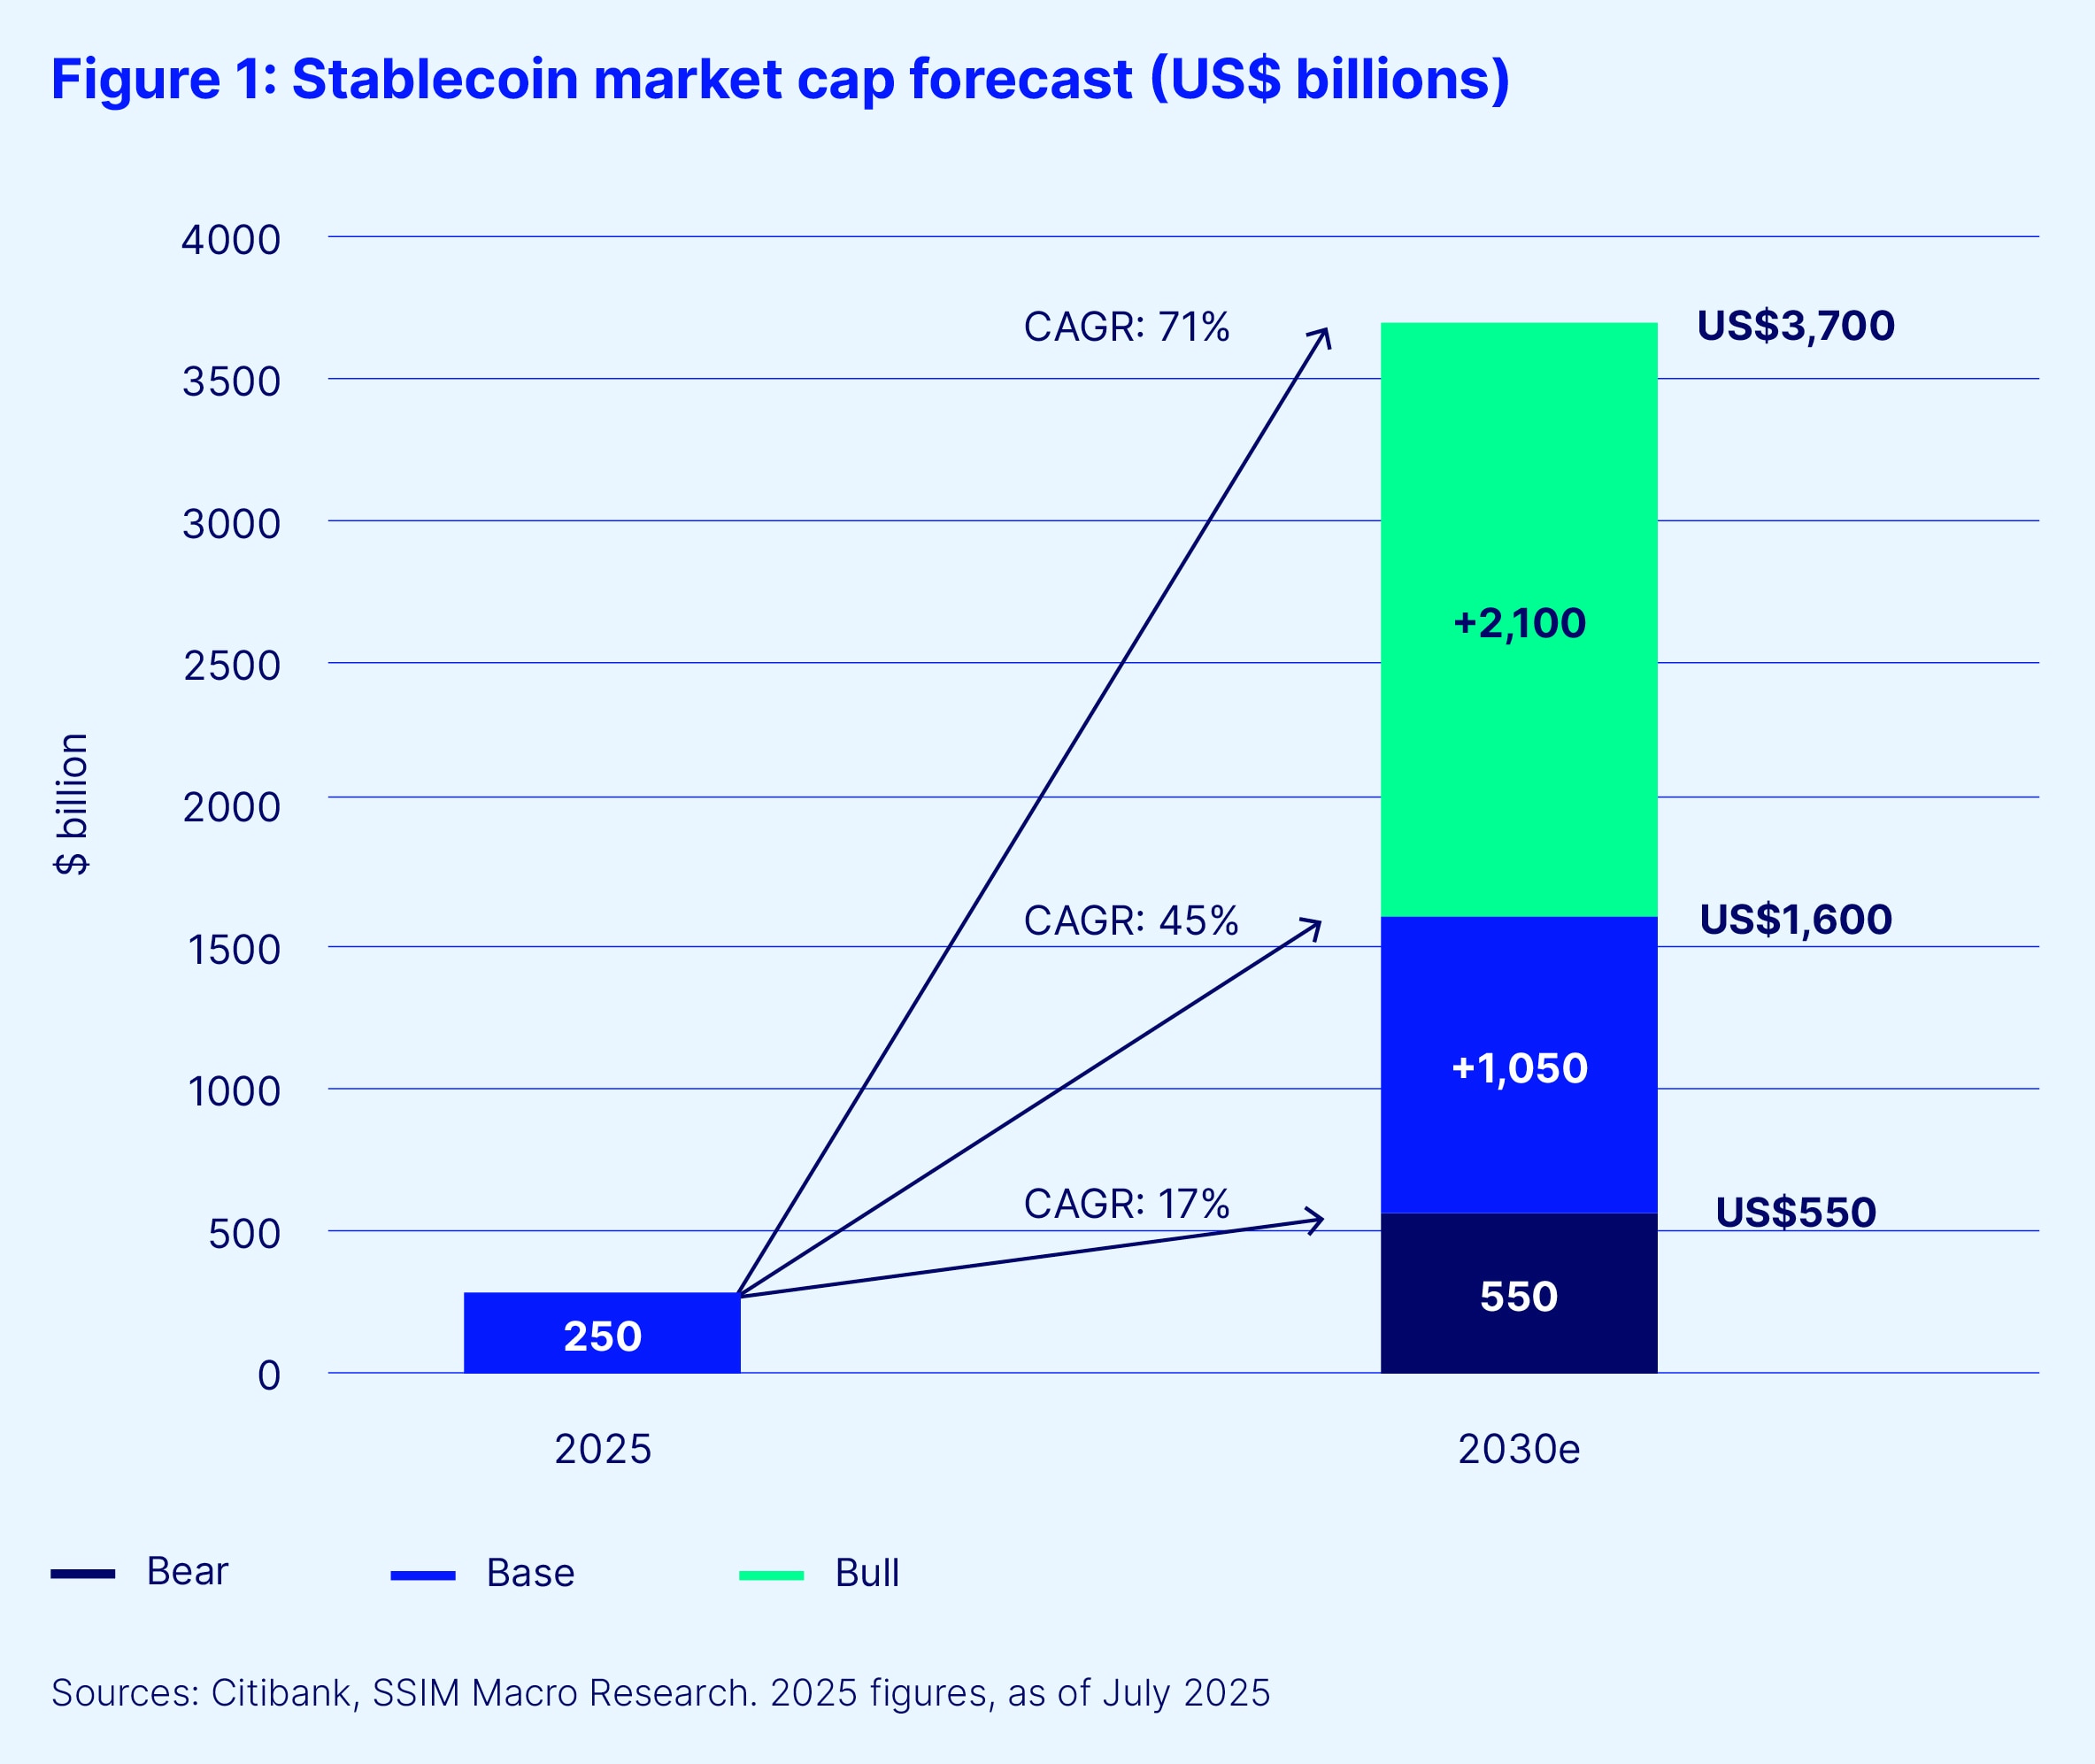
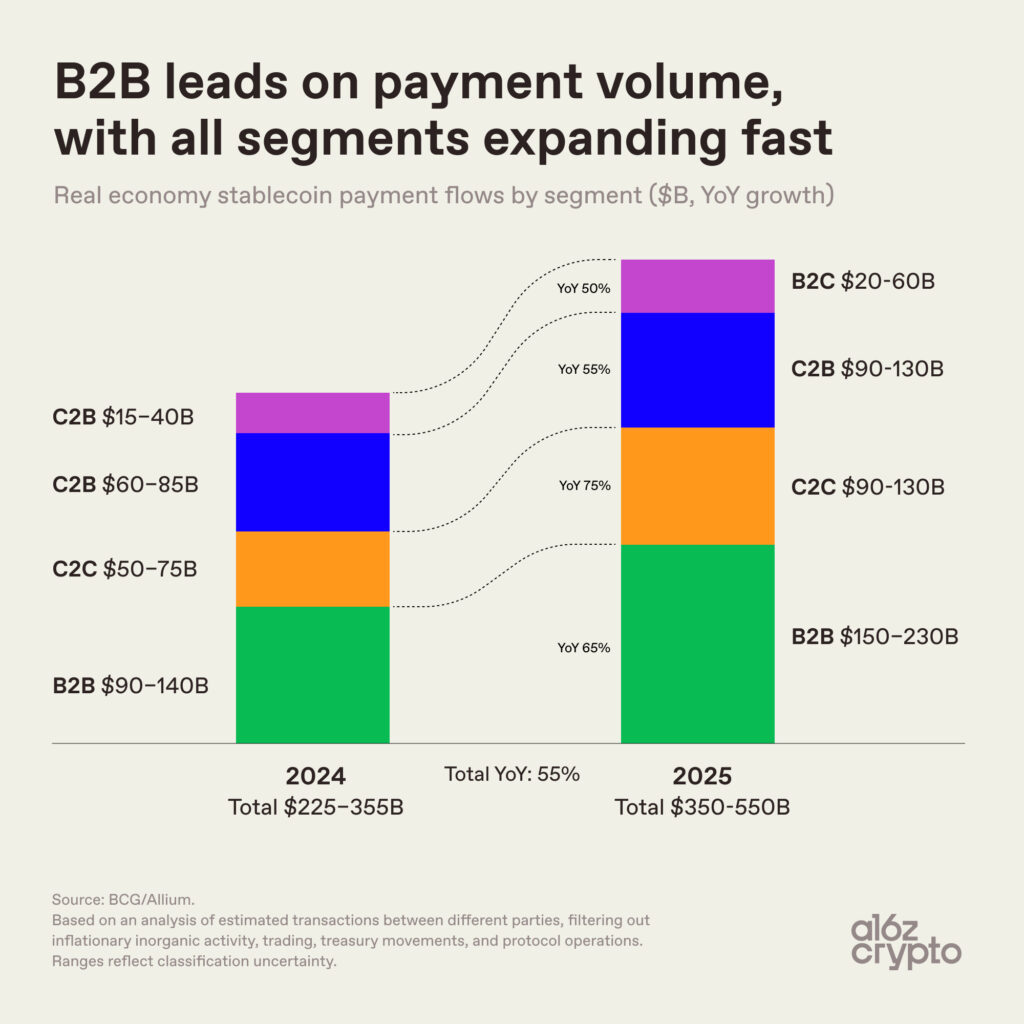
Stablecoin cross-border payments represent a total addressable market of upwards of $17.9tn, according to market sizing data from Forbes. While absolute transaction volumes have exploded due to regulatory clarity and institutional adoption, stablecoins remain just 1% of global payment flows. This share has remained stubbornly unchanged since 2023, highlighting that stablecoins are currently a niche tool rather than a mainstream replacement for traditional banking rails.
The 2026 landscape is defined by this duality: massive potential addressable market versus the practical reality of integrating with existing financial infrastructure. Understanding this gap is essential for evaluating stablecoin flows not as a hype cycle, but as a structural shift in how value moves across borders.
2026 Stablecoin Tradeoffs: Volume vs. Velocity
The market for stablecoin cross-border payments is expanding rapidly, with a total addressable market estimated at over $17.9 trillion. However, stablecoins still account for just 1% of global payment flows, a figure that has remained unchanged since 2023 despite explosive growth in absolute volume. This disconnect highlights the core tradeoff for 2026: regulatory clarity has unlocked institutional liquidity, but adoption is constrained by the sheer inertia of legacy banking rails.
When evaluating stablecoin flows, you must weigh three concrete factors. First, consider the regulatory regime. Jurisdictions with finalized frameworks, such as the EU’s MiCA or the US’s evolving executive orders, offer lower compliance risk but may impose stricter reserve requirements. Second, assess the underlying asset. USD-pegged coins dominate cross-border trade due to their liquidity and stability, while non-USD stablecoins often face higher volatility and regulatory scrutiny. Third, evaluate the settlement layer. Layer 1 blockchains like Solana offer speed and low cost, whereas Ethereum provides security at a higher price point.
The following comparison breaks down the primary tradeoffs between the dominant stablecoin categories in 2026.
| Stablecoin Type | Regulatory Status | Transaction Cost | Speed |
|---|---|---|---|
| USD-Pegged (USDC, USDT) | High clarity in US/EU, evolving elsewhere | Low ($0.01-$0.10) | Seconds to minutes |
| Non-USD Pegged (EURC, GBP-pegged) | Variable, often restricted in major markets | Low to Medium | Seconds to minutes |
| Algorithmic/DeFi-backed | High risk, largely restricted in 2026 | Variable | Variable |
For businesses moving large volumes, the tradeoff shifts from cost to counterparty risk. While algorithmic stablecoins once promised higher yields, the 2026 regulatory landscape has largely pushed institutions toward fully reserved, audited USD-pegged assets. This shift has reduced the total addressable market for non-compliant tokens while consolidating liquidity in a few major issuers. The result is a more efficient, but less diverse, cross-border payment ecosystem.
Choose the next step
Stablecoin Flow Analysis works best as a clear sequence: define the constraint, compare the realistic options, test the tradeoff, and choose the path with the fewest hidden costs. That order keeps the advice usable instead of decorative. After each step, pause long enough to check whether the recommendation still fits the reader's actual situation. If it depends on perfect timing, unusual access, or a best-case budget, include a simpler fallback.
Spotting Misleading Stablecoin Claims
The narrative that stablecoins are about to replace traditional cross-border payments is often overstated. While the total addressable market is estimated at upwards of $17.9 trillion, stablecoins currently account for only 1% of global payment flows. This share has remained unchanged since 2023, despite explosive growth in absolute transaction volume. Regulatory clarity is driving liquidity, but it is not yet driving market share dominance in the broader payments ecosystem.
Be wary of reports that conflate stablecoin market capitalization with actual payment utility. A high market cap indicates investment or reserve holding, not necessarily transactional velocity. When evaluating providers, look for concrete metrics on settlement times and fee structures rather than vague promises of "disruption." The technology is mature, but the adoption curve is slower than many headlines suggest.
Stablecoin flows 2026: what to check next
Regulatory clarity has shifted stablecoins from speculative assets to essential cross-border infrastructure. The following answers address the most common practical questions about market structure, asset classification, and key industry players.
No comments yet. Be the first to share your thoughts!