
As of January 2026, USDC supply on the Base network has crossed $4.2 billion, a stark signal of accelerating adoption amid low fees and Coinbase’s seamless integration. This milestone underscores Base’s rise as a DeFi hub, with USDC inflows reflecting broader stablecoin momentum. Total USDC market cap hit $60.3 billion by March 2025, yet Base’s share highlights shifting liquidity patterns.
Base’s appeal lies in its cost efficiency; transactions average under $0.01, drawing traders and protocols from congested chains. Recent data from DeFiLlama shows USDC leading stablecoins on Base, with daily changes at -0.02%, weekly and 0.11%, and monthly and 0.16%. Trailing are Sky Dollar (USDS) at -0.04% daily and Anzen USDz down sharply -11.10% weekly.
Inflow Surge: Decoding the $4.2B Milestone
USDC on Base didn’t hit this level overnight. From January 1,2025, supply growth mirrors Ethereum and Arbitrum trends per Dune Analytics, but Base’s minting outpaces burns. Net inflows jumped 324% from Q2 to Q3 2025, fueled by USDT and USDC. A Dune-Artemis report notes total stablecoin supply at $225 billion by February, processing $35 trillion in transfers; USDC doubled its footprint.
Base’s USDC dominance isn’t accidental – it’s engineered liquidity meeting DeFi demand.
Compare chains: Ethereum holds 60% of USDC’s $60.3 billion cap, Solana 16%, but Base’s low barrier accelerates retail and institutional flows. Artemis Terminal data reveals USDC’s edge in transfer volumes over rivals in payments and trading across 7D to 5Y views.

Chain Dominance: USDC vs. Competitors on Base
DeFiLlama ranks USDC #1 among Base stablecoins, outpacing USDS and USDz in circulating supply. While USDS shows modest gains ( and 0.18% monthly), USDz lags with volatility. This pecking order matters; USDC’s peg stability – backed by Circle – anchors Base’s TVL growth.
| Stablecoin | 24h | 7D | 30D |
|---|---|---|---|
| USDC | -0.02% | and 0.11% | and 0.16% |
| USDS | -0.04% | -0.21% | and 0.18% |
| USDz | -0.45% | -11.10% | and 0.22% |
USDC’s supply edge translates to dominance in Base DeFi; protocols like Aerodrome and Uniswap rely on it for deep liquidity pools. Check weekly USDC Base inflows for granular charts.
Broader context: Visa’s USDC settlements on Avalanche and Stellar, plus Mastercard pilots, signal TradFi’s stablecoin pivot. On Base, this means sustained inflows as on-ramps proliferate.
USD Coin (USDC) Price Prediction 2027-2032
Forecast for price stability amid Base supply growth surpassing $4.2B and stablecoin market expansion
| Year | Minimum Price | Average Price | Maximum Price | YoY % Change (Avg) |
|---|---|---|---|---|
| 2027 | $0.98 | $1.00 | $1.02 | 0.0% |
| 2028 | $0.985 | $1.00 | $1.015 | 0.0% |
| 2029 | $0.990 | $1.00 | $1.010 | 0.0% |
| 2030 | $0.992 | $1.00 | $1.008 | 0.0% |
| 2031 | $0.995 | $1.00 | $1.005 | 0.0% |
| 2032 | $0.997 | $1.00 | $1.003 | 0.0% |
Price Prediction Summary
USDC is projected to maintain its $1.00 peg through 2032, with minimum prices reflecting bearish depeg risks in market stress (improving over time) and maximums capturing minor premiums in high-demand scenarios. Fluctuations narrow progressively due to enhanced adoption, regulatory clarity, and tech advancements.
Key Factors Affecting USD Coin Price
- Supply growth on Base and L2 chains like Ethereum/Arbitrum boosting liquidity
- Regulatory developments favoring compliant stablecoins like USDC
- Competition from USDT/USDS but USDC’s Coinbase/Circle backing strengthens position
- DeFi, payments, and trading adoption driving transfer volumes
- Market cycles: bull runs may cause temporary premiums, bears test peg resilience
- Tech improvements: better redemption mechanisms reducing depeg risks
Disclaimer: Cryptocurrency price predictions are speculative and based on current market analysis.
Actual prices may vary significantly due to market volatility, regulatory changes, and other factors.
Always do your own research before making investment decisions.
Key Drivers Behind Base’s USDC Boom
Coinbase’s native support supercharges USDC on Base; one-click bridging from wallets funnels billions. Add institutional treasury mints – up to $500 million in peaks – and you see why supply balloons. Yet, risks linger: regulatory scrutiny on Circle could ripple, though transparency bolsters confidence.
21Shares’ 2026 outlook flags stablecoin inflows as crypto’s ballast. Base captures this via USDC, with YTD growth outstripping Ethereum in relative terms. For swing traders, watch mint/burn ratios on Dune; spikes signal accumulation phases.
Read more on tracking USDC Base flows.
These inflows aren’t just numbers; they reshape Base’s liquidity landscape. Aerodrome’s USDC pools now exceed $1 billion in TVL, per DeFiLlama, enabling tighter spreads and higher yields for LPs. Uniswap V3 on Base mirrors this, with USDC pairs driving 40% of volume. Swing traders note the correlation: USDC supply spikes precede TVL pumps by 7-14 days.
USD Coin Technical Analysis Chart
Analysis by Jasper Holden | Symbol: BINANCE:USDCUSDT | Interval: 1h | Drawings: 6
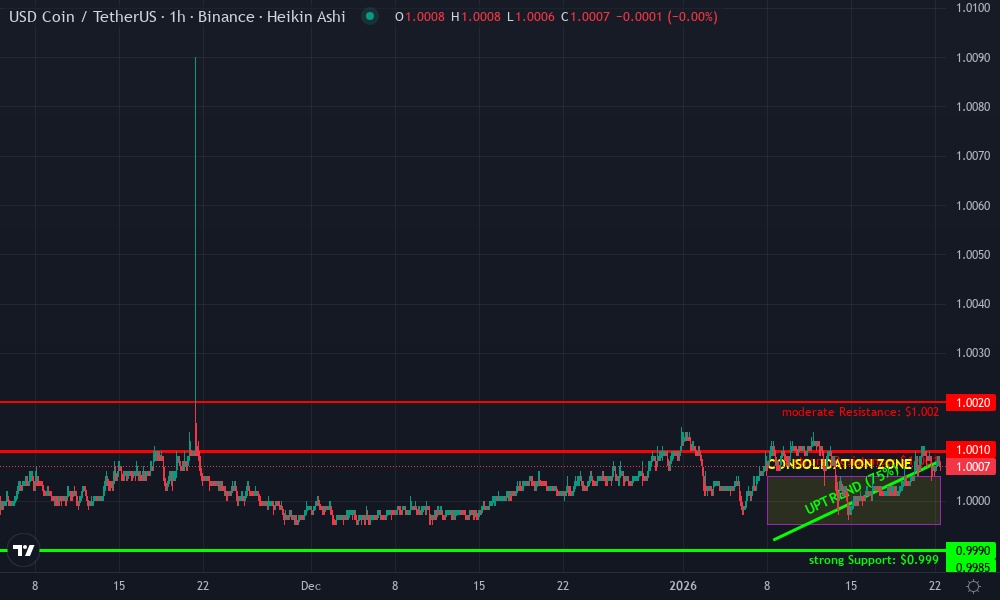
Technical Analysis Summary
Mark the ironclad peg at $1.000 with thick horizontal_lines for support and resistance – this is where the big boys defend. Sketch an aggressive uptrend line from the Dec low at 0.999 hugging the recent highs toward $1.0015, projecting to $1.003 by end-Jan. Rectangle the tight consolidation zone from Jan 8-15 between 0.9995-1.0005. Long_position order_line at $1.0002 entry, profit_target $1.0025, stop_loss $0.9985. Callouts on low volume ‘sleeping giant’ and MACD flattening bullish. Arrow_mark_up at latest green candle for momentum kick.
Risk Assessment: low
Analysis: Stablecoin peg dynamics with massive supply backing minimize downside; micro-swings offer high-reward entries for aggressive traders
Jasper Holden’s Recommendation: Enter long now, target $1.0025 – charts demand action!
Key Support & Resistance Levels
📈 Support Levels:
-
$0.999 – Primary peg floor defended multiple times
strong -
$0.999 – Secondary support on volume lows
moderate
📉 Resistance Levels:
-
$1.001 – Immediate overhead resistance tested
strong -
$1.002 – Swing high target
moderate
Trading Zones (high risk tolerance)
🎯 Entry Zones:
-
$1 – Aggressive long on peg break with volume confirmation
medium risk
🚪 Exit Zones:
-
$1.003 – Profit target at prior swing high extension
💰 profit target -
$0.999 – Tight stop below key support
🛡️ stop loss
Technical Indicators Analysis
📊 Volume Analysis:
Pattern: low and contracting
Ultra-low volume signals tight consolidation, poised for expansion on breakout
📈 MACD Analysis:
Signal: bullish divergence flattening
MACD histogram narrowing positive, histogram bars hinting upside crossover
Applied TradingView Drawing Utilities
This chart analysis utilizes the following professional drawing tools:
Disclaimer: This technical analysis by Jasper Holden is for educational purposes only and should not be considered as financial advice.
Trading involves risk, and you should always do your own research before making investment decisions.
Past performance does not guarantee future results. The analysis reflects the author’s personal methodology and risk tolerance (high).
Artemis Terminal charts confirm USDC’s transfer volume lead across 1M-1Y periods, dominating payments (65% share) and DeFi (52%). This isn’t hype; it’s on-chain proof of Base’s maturation as a layer-2 contender.
On-Chain Signals for Traders
Dune queries on Ethereum, Arbitrum, Base reveal mint/burn imbalances favoring accumulation. Base’s ratio sits at 1.8: 1 mints-to-burns over 6M, signaling net positive flows. Pair with Chainlink’s USDC/USD feed – market cap $56.8 billion, 24h volume $10.8 billion – and peg holds firm at $1.
For pragmatic plays, monitor weekly USDC Base supply via DefiLlama. Thresholds above $4.5 billion could trigger DeFi rotations from Solana. Risks? Congestion if inflows overwhelm, though Base’s throughput scales to 100k TPS.
21Shares highlights stablecoins as 2026’s anchor amid volatility. Base’s USDC traction positions it for institutional on-ramps, echoing Visa and Mastercard moves. Retail follows: Coinbase users bridge seamlessly, padding supply.
Patterns emerge in cycles. Post-2025 halving, USDC Base flows mirrored 2021’s layer-1 boom, but with lower costs. My take: Base captures 10% of USDC’s total by mid-2026 if trends hold, challenging Solana’s 16% slice.
Investors, anchor strategies here. USDC Base supply at $4.2 billion marks not a peak, but a base for expansion. Charts whisper persistence; let them guide your edge in this stablecoin surge.