
In 2025, USDC inflows on the Base chain have captured the attention of crypto analysts, reflecting both the volatility and potential of Layer 2 ecosystems. Despite mid-year outflows totaling $4.3 billion driven by entities like Binance shifting capital to Ethereum Layer 1, early-year net inflows approached $3.8 billion, underscoring Base's appeal as a low-cost scaling solution for stablecoin transactions. This dynamic USDC Base inflows pattern aligns with broader stablecoin trends Base chain, where USDC's market share climbed amid a total stablecoin float surpassing $270 billion, per Artemis Terminal data.
Base, Coinbase's Ethereum Layer 2, processed significant USDC on-chain data Base volumes in the first half of 2025, fueled by DeFi activity and native integrations. Artemis Analytics highlights cross-border flows settled via USDC and USDT nearing $400 billion annually, with stablecoin payments volumes jumping 70% to over $10 billion by August. These figures illustrate how Base chain stablecoin flows contribute to USDC's momentum, even as total value locked metrics give way to real-world usage indicators like merchant adoption.
Dissecting 2025 On-Chain Flow Fluctuations
The year began strong for USDC adoption Base 2025, with capital flooding into Base for its sub-cent transaction fees and seamless Ethereum compatibility. Net inflows peaked early, drawing liquidity for lending protocols and DEXs. However, July marked a reversal: $4.3 billion in outflows as whales repatriated funds to Ethereum mainnet, coinciding with ether deposit declines on Base. CoinDesk reported this shift, attributing it to strategic rotations amid market uncertainty.
Base saw net outflows totaling $4.3 billion by July 2025, largely from major entities withdrawing to Ethereum Layer 1.
Yet, this pullback did not signal retreat. On-chain metrics from DefiLlama and Chainalysis reveal resilient activity, with USDC transfers sustaining high velocity. Q1-Q3 net flows data shows USDC bucking broader trends, posting positive figures while competitors stabilized. Bernstein analysts project USDC supply tripling to $220 billion by 2027, capturing one-third of the market, a trajectory Base inflows could accelerate.
USDC's Competitive Edge in Base's Ecosystem
USDC stands out in Base's stablecoin landscape due to its regulatory compliance and backing by Circle, contrasting USDT's dominance. Artemis Terminal's dashboard tracks cross-chain KPIs, showing USDC's trade volume and user flows gaining ground. In a market where stablecoin settlement hit $10 billion monthly, Base's role in Base chain stablecoin flows emphasizes efficiency over sheer size.
Cobo's analysis points to a shift from TVL obsession to gray-zone applications: AI agents, payment rails, and commoditized issuance. Here, USDC shines on Base, natively issued and optimized for transfers. Visual Capitalist's state-of-stablecoins report, drawing from DefiLlama as of June 30,2025, confirms on-chain structures favoring USDC for enterprise use.
USDC Price Prediction 2026-2031
Forecast reflecting peg stability amid Base chain inflows, supply growth to $220B by 2027, and evolving stablecoin adoption trends despite 2025 outflows
| Year | Minimum Price | Average Price | Maximum Price |
|---|---|---|---|
| 2026 | $0.95 | $1.00 | $1.05 |
| 2027 | $0.97 | $1.00 | $1.03 |
| 2028 | $0.98 | $1.00 | $1.02 |
| 2029 | $0.99 | $1.00 | $1.01 |
| 2030 | $0.995 | $1.00 | $1.005 |
| 2031 | $0.998 | $1.00 | $1.002 |
Price Prediction Summary
USDC is forecasted to robustly maintain its $1 USD peg through 2031, with narrowing fluctuation ranges as adoption surges, regulatory support strengthens, and ecosystem integrations like Shopify on Base enhance utility. Bearish minima account for potential short-term depegs during market volatility, while maxima reflect demand-driven premiums in bullish cycles.
Key Factors Affecting USD Coin Price
- Bernstein's projection of USDC supply tripling to $220B by 2027
- Base chain integrations and payment volumes exceeding $10B in 2025
- Shifting stablecoin usage to real-world payments and AI agents
- Regulatory clarity boosting enterprise adoption
- Competition with USDT but rising USDC market share
- L2 scaling improvements and cross-chain flows reducing depeg risks
Disclaimer: Cryptocurrency price predictions are speculative and based on current market analysis. Actual prices may vary significantly due to market volatility, regulatory changes, and other factors. Always do your own research before making investment decisions.
Shopify Integration Boosts Practical Adoption
A pivotal development arrived in Q2 2025: Coinbase's integration of USDC payments on Base with Shopify Payments. Merchants can now accept USDC seamlessly, converting to fiat instantly. This move, detailed in Coinbase's shareholder letter, targets real-world utility, bridging DeFi and e-commerce. For investors tracking USDC Base inflows, this signals sustained demand beyond speculative trading. For more on real-time insights, Base's evolution merits close watch.
Bastion's 2025 stablecoin breakdown and Observers. com's Dune Analytics report from February 2024-2025 further validate enterprise trends, with asset-backed models like USDC leading adoption. As Base rebounds from outflows, these integrations position it for renewed inflow surges, potentially sparking broader stablecoin waves.
These developments come at a time when stablecoin metrics are evolving beyond traditional on-chain volumes. MEXC's analysis of Q1-Q3 2025 net flows reveals USDC's resilience, with positive net issuance even as USDT maintained its lead. This data point, often overlooked, hints at a tipping mechanism: as USDC adoption Base 2025 embeds in payment layers, Base could catalyze the next trillion-dollar expansion in digital dollars.
USD Coin Technical Analysis Chart
Analysis by Elena Rios | Symbol: BINANCE:USDCUSDT | Interval: 1D | Drawings: 8
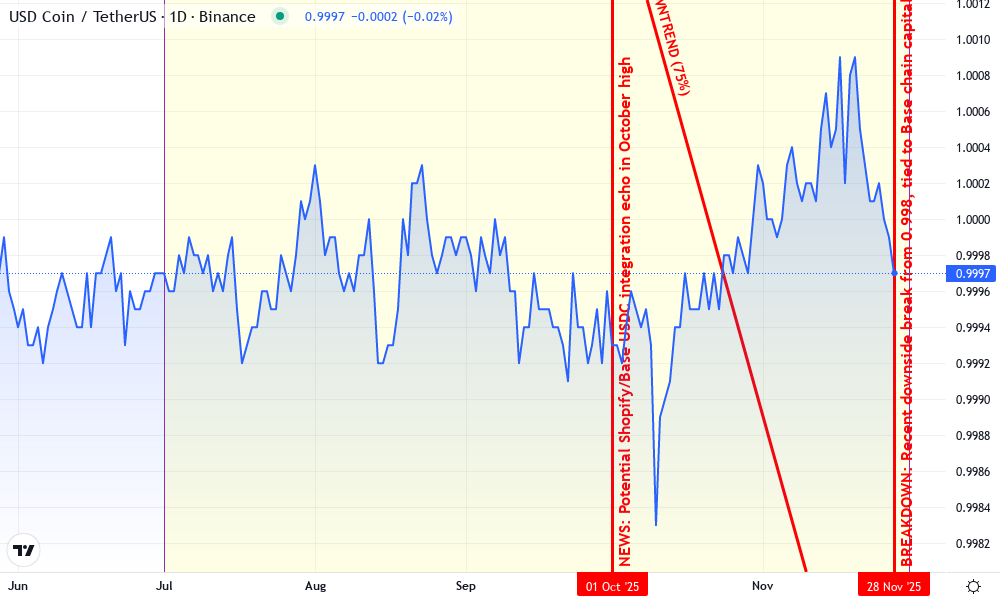
Technical Analysis Summary
As Elena Rios, with my balanced fundamental lens on stablecoin dynamics, annotate this USDCUSDT 1D chart as follows: 1. Draw a horizontal line at 0.996 marking the recent December low as key support, using a thick blue line for emphasis. 2. Add a horizontal resistance line at 1.004 from the October peak, dashed red. 3. Sketch a short-term downtrend line connecting the August high near 1.006 (approx 2025-08-20) to the current December low at 0.996, with moderate slope. 4. Highlight the overall consolidation rectangle from July 2025 low (0.992) to December high (1.006), shading light gray. 5. Place callout texts on volume spikes in September and November noting 'elevated volume on downside'. 6. Mark a vertical line at estimated late November 2025 for potential news-driven dip. 7. Add up arrows at support for entry zones and down arrows for recent breakdown. This setup underscores the tight peg stability amid 2025 USDC adoption surges, priming for mean reversion.
Risk Assessment: low
Analysis: Stablecoin pair's ultra-tight range (0.8% deviation) and fundamental tailwinds from 2025 growth metrics minimize depeg risk; volatility suits medium tolerance
Elena Rios's Recommendation: Accumulate longs at support for peg reversion—clarity drives conviction in USDC's trajectory
Key Support & Resistance Levels
📈 Support Levels:
- $0.996 - December 2025 swing low, reinforced by high volume and historical peg floor strong
- $0.992 - July 2025 base, secondary support from early-year consolidation moderate
📉 Resistance Levels:
- $1.004 - October 2025 high, repeated rejection amid stablecoin float highs strong
- $1.006 - August 2025 spike high, less tested recently moderate
Trading Zones (medium risk tolerance)
🎯 Entry Zones:
- $0.996 - Bounce from strong support in tight range, aligned with USDC adoption tailwinds low risk
- $0.998 - Mid-range pullback entry for scalps, medium risk per my tolerance medium risk
🚪 Exit Zones:
- $1.002 - Mean reversion target to midline, conservative profit 💰 profit target
- $1.004 - Resistance test for extension plays 💰 profit target
- $0.994 - Break below support invalidates peg stability 🛡️ stop loss
Technical Indicators Analysis
📊 Volume Analysis:
Pattern: spikes on downside moves
Elevated volume during September and late November dips suggests distribution but contained within peg; no panic selling
📈 MACD Analysis:
Signal: bearish divergence near zero line
MACD flattening post-October, hinting momentum slowdown but no deep bear cross—stablecoin norm
Applied TradingView Drawing Utilities
This chart analysis utilizes the following professional drawing tools:
Disclaimer: This technical analysis by Elena Rios is for educational purposes only and should not be considered as financial advice. Trading involves risk, and you should always do your own research before making investment decisions. Past performance does not guarantee future results. The analysis reflects the author's personal methodology and risk tolerance (medium).
Such granularity underscores why investors prioritize stablecoin trends Base chain over aggregate TVL. Outflows to Ethereum Layer 1 were tactical, not terminal; ether inflows there reached $8.5 billion concurrently, per CoinDesk, signaling ecosystem rebalancing rather than Base abandonment.
Looking ahead, Bernstein's forecast of USDC supply reaching $220 billion by 2027- tripling from current levels- hinges on chains like Base. Native USDC issuance here minimizes bridging risks, appealing to institutions wary of fragmented liquidity. Elements by Visual Capitalist's June 30,2025 snapshot confirms this: on-chain structures favor compliant stables for scalable apps.
Implications for DeFi and Beyond
Base's journey reflects a maturing stablecoin ecosystem. Early 2025 hype drew speculative capital, but mid-year outflows tested resolve. What emerged was utility: Shopify's rollout enables merchants to tap USDC without crypto volatility exposure, converting instantly to fiat. This gray-zone shift, as Cobo terms it, prioritizes payments over locked liquidity- AI agents settling micro-transactions, cross-border rails handling $400 billion yearly via USDC/USDT pairs.
For analysts, Base chain stablecoin flows offer a lens into adoption velocity. Dune and Artemis reports from 2024-2025 show USDC's user growth outpacing supply, driven by Base's fee efficiency. Bastion highlights emerging asset-backed models, positioning USDC as enterprise-grade amid regulatory clarity.
Challenges persist: Multichain Bridged USDC (Fantom) trades at $0.0237, down 0.1025% over 24 hours, reminding us of peg risks in niche bridges. Yet Base's native USDC sidesteps such issues, fostering trust. As inflows potentially reverse- with ether deposits stabilizing- Base could reclaim momentum, drawing from Ethereum's overflow.
USDC's Base integrations signal a pivot from DeFi speculation to programmable money, where low fees meet real demand.
Investors eyeing USDC Base adoption trends should monitor Artemis dashboards for user flows and transfer counts. Positive Q4 signals, paired with Bernstein's projections, suggest Base inflows may not just recover but redefine stablecoin scaling. In a $270 billion float landscape, chains proving practical utility will lead; Base, with Coinbase's backing, appears primed. For deeper dives into key metrics, ongoing tracking reveals conviction-building patterns.

No comments yet. Be the first to share your thoughts!