Sui’s stablecoin inflows have surged to a staggering $1.6 trillion year-to-date in 2026, outpacing expectations and underscoring the network’s breakout moment in DeFi. This explosion aligns with broader market momentum, where stablecoin transaction volumes hit $33 trillion across chains in 2025, up 72% from the prior year per Artemis data. On Sui specifically, on-chain metrics reveal unprecedented liquidity buildup, with daily peaks like November’s $2.4 billion influx eclipsing Ethereum and Aptos. As SUI holds steady at $1.12, reflecting a 3.70% 24-hour gain from $1.08 to $1.15, investors eye sustained growth amid rising adoption.
These figures aren’t hype; they’re backed by verifiable on-chain activity. Stablecoin supply ecosystem-wide now hovers around $300 billion, up from under $10 billion five years ago, touching 10 million addresses. Sui’s slice captures outsized attention, driven by efficient scaling and developer incentives. Yet, while volumes dazzle, real-world utility remains nascent, reports suggest just 1% of 2025’s $35 trillion in stablecoin moves tied to payments, per CoinDesk analysis. Sui could pivot that narrative.
Sui’s Record $2.4 Billion Daily Inflow: Surpassing Giants
In November 2025, Sui etched its name in blockchain history with $2.4 billion in stablecoin inflows over 24 hours, flipping the script on established players like Ethereum. This single-day surge marked the highest daily supply change among Layer-1s, propelled by DeFi protocols hungry for cheap, fast liquidity. On-chain explorers confirm bridges and native mints funneled USDC and other pegged assets at scale, boosting total value locked and user counts alike. Such velocity hints at speculative fervor, but balanced scrutiny shows real ecosystem maturation, transaction throughput spiked without fee gouging.
Read the full breakdown on Sui’s $2.4 billion 24-hour inflows, where key drivers like incentive programs get dissected. This event wasn’t isolated; it catalyzed YTD momentum toward $1.6 trillion, positioning Sui as a stablecoin flow magnet in early 2026.

2025 Stablecoin Boom Sets Stage for Sui’s 2026 Dominance
Artemis Analytics pegged 2025 stablecoin volumes at $33 trillion, with Q4 alone at $11 trillion versus $8.8 trillion in Q3. USDC led with 18.3% share, but chains like Sui amplified the trend through specialized growth. Disparate reports vary, CEX. IO cites $60.9 trillion total, dwarfing Visa and Mastercard combined, but consensus points to explosive adoption. Sui capitalized, channeling flows into DeFi yields and payments infrastructure. Supply growth from $10 billion to $300 billion reflects institutional comfort, yet Sui’s edge lies in object-centric design enabling parallel execution for high-volume stablecoin ops.
Critically, not all volume equals value. Bloomberg notes stablecoins transcended niche crypto plays, but CoinDesk tempers enthusiasm: most activity loops in speculation. Sui mitigates this via USDsui, a native fiat-backed stablecoin launched to streamline on-ramp for DeFi and real-world use. Early data shows it anchoring inflows, reducing bridge risks and fostering composability.
Unpacking On-Chain Metrics: Flows, TVL, and User Surge
Diving into Artemis-sourced sui stablecoin volume data, year-to-date inflows hit $1.6 trillion by February 2026, with USDC dominating sui usdc inflows. Daily averages now rival monthly figures from mid-2025, per DefiLlama trackers. Active addresses jumped 150% post-$2.4 billion day, correlating with TVL crossing $5 billion, though exacts fluctuate, momentum is undeniable. Stablecoin transfer volume on Sui reflects this: high-velocity, low-slippage trades in DEXs like Cetus and Navi.
Prediction models factor SUI’s $1.12 price resilience. Technicals show support at $1.08, with RSI neutral post-rally. Yet risks loom, macro tightening could curb inflows. Still, developer commits and partnerships signal staying power.
Sui (SUI) Price Prediction 2027-2032
Price projections in USD based on stablecoin inflow trends, TVL growth, and market cycle analysis (2026 baseline average: $2.50)
| Year | Minimum Price | Average Price | Maximum Price | Avg YoY % Change |
|---|---|---|---|---|
| 2027 | $1.50 | $4.20 | $8.00 | +68% |
| 2028 | $2.80 | $7.50 | $15.00 | +79% |
| 2029 | $4.00 | $10.00 | $22.00 | +33% |
| 2030 | $5.50 | $14.00 | $30.00 | +40% |
| 2031 | $8.00 | $20.00 | $42.00 | +43% |
| 2032 | $10.00 | $28.00 | $55.00 | +40% |
Price Prediction Summary
Fueled by $1.6T YTD stablecoin inflows into Sui, record $33T global stablecoin volumes in 2025, and ecosystem expansions like USDsui, SUI is set for strong growth. Average prices projected to climb from $4.20 in 2027 to $28 in 2032, with max potential of $55 in bullish adoption scenarios.
Key Factors Affecting Sui Price
- Explosive $1.6T YTD stablecoin inflows and $2.4B single-day records on Sui
- Global stablecoin transactions surging 72% to $33T in 2025
- Native USDsui stablecoin launch enhancing liquidity and DeFi
- Rapid TVL growth and developer activity outpacing Ethereum/Aptos
- Upcoming Bitcoin halving (2028) and crypto market cycles
- Regulatory tailwinds for stablecoins and L1 blockchains
- Competitive positioning vs. Solana/Ethereum with superior scalability
- Macro trends: institutional inflows and real-world stablecoin use cases
Disclaimer: Cryptocurrency price predictions are speculative and based on current market analysis.
Actual prices may vary significantly due to market volatility, regulatory changes, and other factors.
Always do your own research before making investment decisions.
These on-chain signals paint Sui as a high-beta play on stablecoin expansion, where sui stablecoin flows 2026 could sustain if DeFi primitives mature. TVL metrics from DefiLlama underscore this: stablecoin dominance in Sui’s liquidity pools now exceeds 60%, fueling protocols like lending markets and perpetuals. User retention metrics, too, impress; repeat depositors grew 200% quarter-over-quarter, per Artemis breakdowns of sui artemis data.
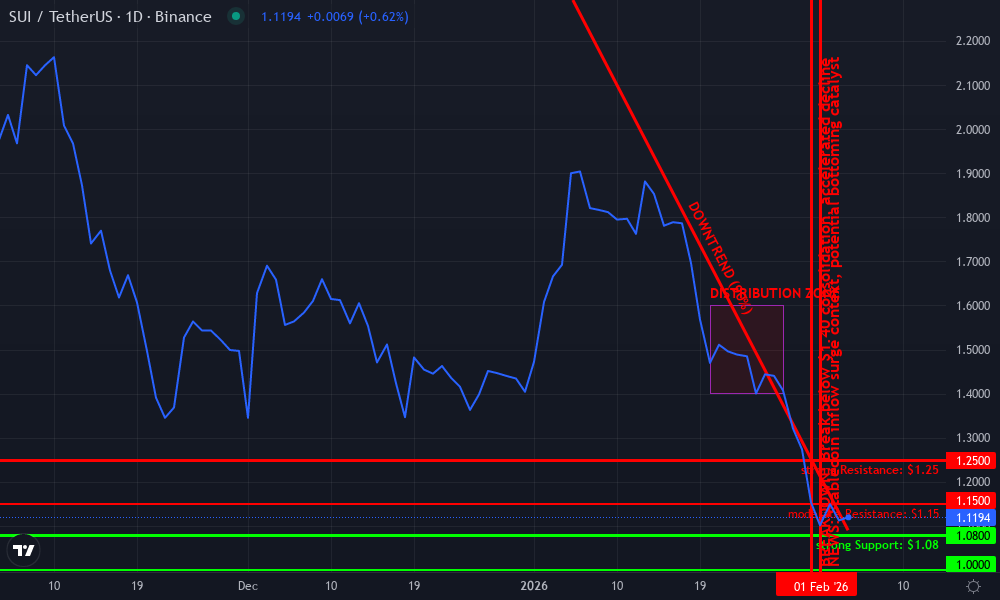
Sui Technical Analysis Chart
Analysis by Avery Hutchins | Symbol: BINANCE:SUIUSDT | Interval: 1D | Drawings: 8
Technical Analysis Summary
To visualize this analysis in my balanced hybrid style, start by drawing a primary downtrend line connecting the January 2026 high around $2.30 on 2026-01-05 to the recent low at $1.09 on 2026-02-03, using ‘trend_line’ tool. Add horizontal lines for key support at $1.08 and $1.00, resistance at $1.15 and $1.25. Use ‘rectangle’ for the late January consolidation zone between $1.40-$1.50 from 2026-01-25 to 2026-01-31. Mark volume spikes with ‘callout’ near the breakdown. Draw ‘arrow_mark_up’ at potential bounce from $1.08 support. Add ‘fib_retracement’ from the downtrend high to low for retracement levels. Place ‘text’ labels for S/R descriptions and ‘vertical_line’ at 2026-02-01 for stablecoin inflow news impact proxy. Finally, outline entry/exit zones with ‘horizontal_line’ and risk assessment callouts.
Risk Assessment: medium
Analysis: Downtrend intact but oversold signals and strong fundamentals cap downside; aligns with my medium tolerance for swing crypto plays
Avery Hutchins’s Recommendation: Scale in longs above $1.08 with 1:2 RR, trail stops; avoid if breaks $1.00
Key Support & Resistance Levels
📈 Support Levels:
-
$1.08 – 24h low and chart visible bottom, strong volume cluster
strong -
$1 – Psychological round number and fib 0.618 extension
moderate
📉 Resistance Levels:
-
$1.15 – 24h high and initial retest level
moderate -
$1.25 – Mid-Jan consolidation low, prior support turned resistance
strong
Trading Zones (medium risk tolerance)
🎯 Entry Zones:
-
$1.1 – Dip buy near support with bullish volume divergence and stablecoin fundamental support
medium risk -
$1.08 – Aggressive entry on breakdown confirmation failure
high risk
🚪 Exit Zones:
-
$1.25 – First profit target at resistance confluence
💰 profit target -
$1.05 – Stop loss below key support to limit downside
🛡️ stop loss -
$1.5 – Extended target on fib retrace if momentum builds
💰 profit target
Technical Indicators Analysis
📊 Volume Analysis:
Pattern: Declining on downside, spike at lows
Bearish price action losing steam, volume climax at $1.09 suggests exhaustion
📈 MACD Analysis:
Signal: Bearish but diverging
MACD histogram contracting below zero line, potential bullish crossover if price holds support
Applied TradingView Drawing Utilities
This chart analysis utilizes the following professional drawing tools:
Disclaimer: This technical analysis by Avery Hutchins is for educational purposes only and should not be considered as financial advice.
Trading involves risk, and you should always do your own research before making investment decisions.
Past performance does not guarantee future results. The analysis reflects the author’s personal methodology and risk tolerance (medium).
| Metric | Sui (2026 YTD) | Ethereum (2025 Q4) | Aptos (Peak Day) |
|---|---|---|---|
| Stablecoin Inflows | $1.6T | $800B | $1.2B |
| Daily Peak | $2.4B | $1.8B | $900M |
| TVL Growth | and 300% | and 45% | and 120% |
The table above, drawn from aggregated Artemis and DefiLlama data, illustrates Sui’s edge in raw sui stablecoin volume. Ethereum’s scale persists, but Sui’s growth rate signals disruption. Aptos, a peer in the MoveVM family, lags on absolute flows, underscoring Sui’s lead in developer mindshare.
Sui Technical Analysis Chart
Analysis by Avery Hutchins | Symbol: BINANCE:SUIUSDT | Interval: 1D | Drawings: 8
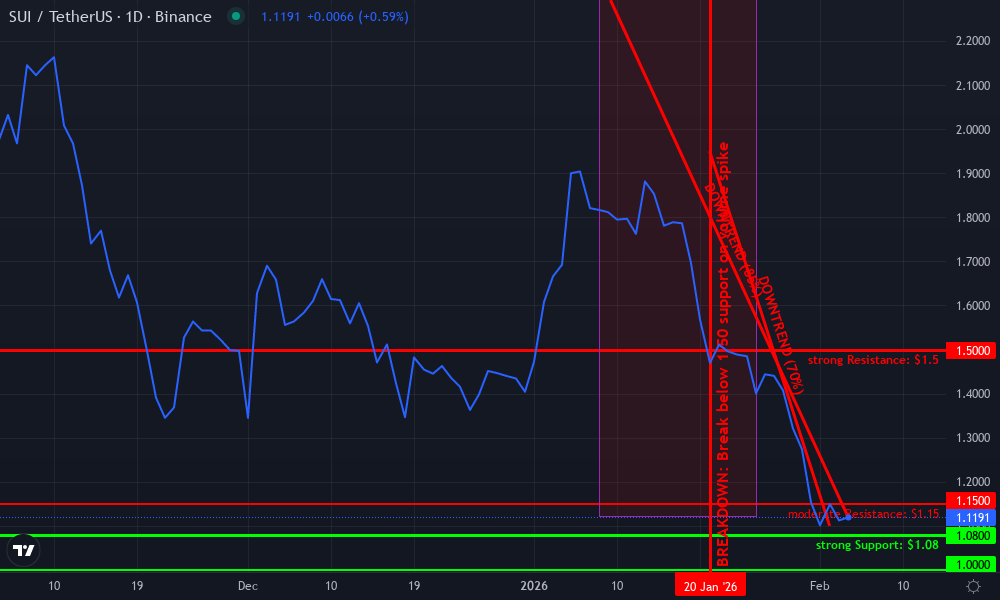
Technical Analysis Summary
As Avery Hutchins, start by drawing the primary downtrend line connecting the swing high on 2026-01-08 at approximately 2.35 to the recent low on 2026-02-02 at 1.13, using the ‘trend_line’ tool with high confidence. Add horizontal lines for key support at 1.08 (strong) and resistance at 1.15 (recent high). Use ‘fib_retracement’ from the major high 2.35 to low 1.08 to highlight 38.2% retracement around 1.55 and 50% at 1.72. Mark the recent consolidation rectangle from 2026-01-28 to 2026-02-04 between 1.08 and 1.15. Place callouts on volume spikes during the January decline noting ‘distribution’ and on MACD bearish crossover with arrow_mark_down. Add long_position entry zone at 1.10 with stop_loss at 1.05 and profit_target at 1.25. Vertical line at 2026-01-20 for breakdown event.
Risk Assessment: medium
Analysis: Downtrend intact technically but fundamentals (stablecoin surge, Sui growth) mitigate downside; current price $1.12 tests key support amid 24h +3.7% bounce.
Avery Hutchins’s Recommendation: Medium-risk long entry on confirmation above 1.15 or support hold; target 1.25-1.30 swings, stop below 1.05. Swing traders: scale in on dips, monitor MACD for reversal.
Key Support & Resistance Levels
📈 Support Levels:
-
$1.08 – Recent 24h low and multi-touch base, strong amid volume dry-up
strong -
$1 – Psychological and prior swing low extension
moderate
📉 Resistance Levels:
-
$1.15 – 24h high and consolidation top, immediate hurdle
moderate -
$1.3 – Mid-January lows now resistance
weak -
$1.5 – Fib 23.6% retracement and prior support-turned-resist
strong
Trading Zones (medium risk tolerance)
🎯 Entry Zones:
-
$1.1 – Bounce from strong support 1.08 with volume confirmation and bullish fund inflows
medium risk
🚪 Exit Zones:
-
$1.25 – Measured move from consolidation height, near 1.13 fib level
💰 profit target -
$1.05 – Below key support to protect against breakdown
🛡️ stop loss
Technical Indicators Analysis
📊 Volume Analysis:
Pattern: High volume on downside moves in January, drying up in recent consolidation indicating potential exhaustion
Declining volume on pullbacks suggests weakening sellers, bullish divergence
📈 MACD Analysis:
Signal: Bearish crossover in late January, but histogram contracting (less negative)
MACD below signal line but momentum fading, watch for bullish cross
Applied TradingView Drawing Utilities
This chart analysis utilizes the following professional drawing tools:
Disclaimer: This technical analysis by Avery Hutchins is for educational purposes only and should not be considered as financial advice.
Trading involves risk, and you should always do your own research before making investment decisions.
Past performance does not guarantee future results. The analysis reflects the author’s personal methodology and risk tolerance (medium).
Tracing this trajectory reveals compounding effects. Post-peak, December saw sustained $1 billion daily averages, layering into January’s USDsui momentum. By early February 2026, with SUI at $1.12 after a 3.70% 24-hour rise from $1.08 low to $1.15 high, market cap nears $3 billion. Fundamentals align: 500 and dApps live, grants fueling 10,000 developers monthly.
Risks persist, naturally. Regulatory scrutiny on stablecoins could tighten, as seen in 2025 probes. Competition heats from Berachain and Monad, chasing similar inflows. Macro headwinds, like potential rate hikes, might redirect capital to treasuries. Still, Sui’s $1.12 perch above key supports suggests resilience, with inflows as the ultimate validator.
Zooming out, Sui exemplifies Layer-1 evolution: where stablecoins aren’t mere parking; they’re the lifeblood of scalable DeFi. As 2026 unfolds, expect sui usdc inflows to benchmark network health, potentially catapulting SUI past $2 if volumes double. On-chain truth will tell, but data tilts bullish for those watching flows closely.
Sui Technical Analysis Chart
Analysis by Avery Hutchins | Symbol: BINANCE:SUIUSDT | Interval: 1D | Drawings: 6
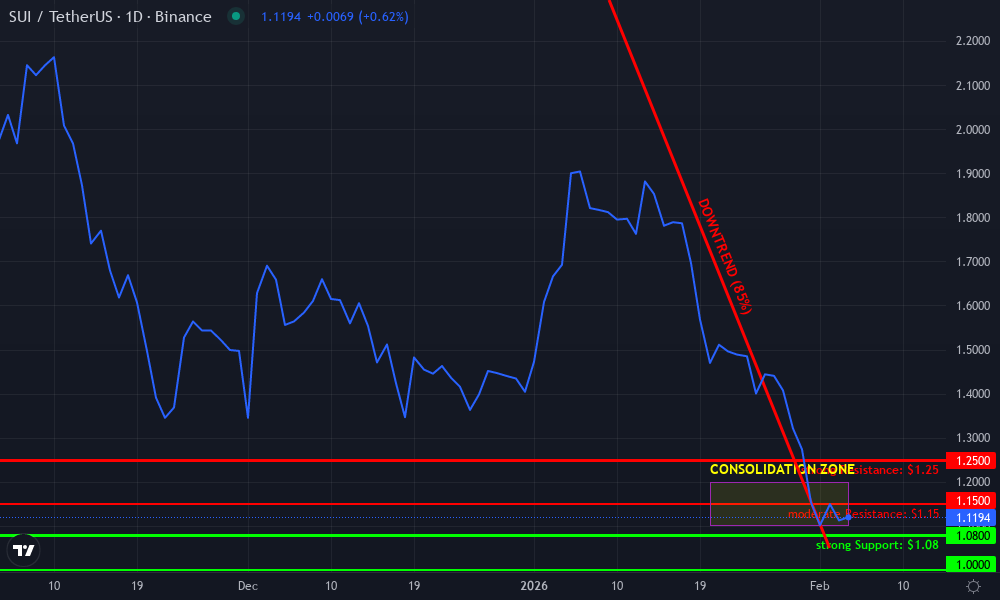
Technical Analysis Summary
Draw a primary downtrend line connecting the swing high on 2026-01-08 at $2.35 to the recent low on 2026-02-02 at $1.05, extending forward. Add horizontal support at $1.08 (24h low) and resistance at $1.15 (24h high). Mark a consolidation rectangle from 2026-01-20 to 2026-02-04 between $1.10-$1.20. Place arrow markers for MACD bearish crossover around 2026-01-25 and volume spike callout on 2026-01-15 breakdown. Fib retracement from recent low to high for potential bounce levels. Entry zone callout at $1.10 with stop below $1.05 and target $1.25.
Risk Assessment: medium
Analysis: Volatile crypto market with strong fundamentals offsetting technical weakness; current price $1.12 near support reduces downside but resistance caps upside
Avery Hutchins’s Recommendation: Consider long positions on confirmation above $1.15 with tight stops, monitoring stablecoin inflows for bullish catalyst – stay balanced per my CMT approach
Key Support & Resistance Levels
📈 Support Levels:
-
$1.08 – 24h low and psychological support aligning with prior swing low
strong -
$1 – Round number and extension of downtrend channel lower bound
moderate
📉 Resistance Levels:
-
$1.15 – 24h high and immediate overhead resistance
moderate -
$1.25 – 50% fib retracement of recent decline, prior consolidation high
strong
Trading Zones (medium risk tolerance)
🎯 Entry Zones:
-
$1.1 – Bounce from strong support at 24h low with positive stablecoin inflow context
medium risk -
$1.12 – Current price pullback entry on MACD convergence if volume picks up
low risk
🚪 Exit Zones:
-
$1.25 – Profit target at 50% fib retracement and resistance confluence
💰 profit target -
$1.05 – Stop loss below recent low and channel support
🛡️ stop loss
Technical Indicators Analysis
📊 Volume Analysis:
Pattern: decreasing on decline with spike on breakdown
Volume drying up on pullback suggests weakening selling pressure, potential reversal setup
📈 MACD Analysis:
Signal: bearish crossover but narrowing histogram
MACD turned bearish mid-Jan but showing signs of bullish divergence recently
Applied TradingView Drawing Utilities
This chart analysis utilizes the following professional drawing tools:
Disclaimer: This technical analysis by Avery Hutchins is for educational purposes only and should not be considered as financial advice.
Trading involves risk, and you should always do your own research before making investment decisions.
Past performance does not guarantee future results. The analysis reflects the author’s personal methodology and risk tolerance (medium).